Austin Real Estate Market Intelligence

Austin's Housing Market Pulls Back as National Headwinds Reach Central Texas

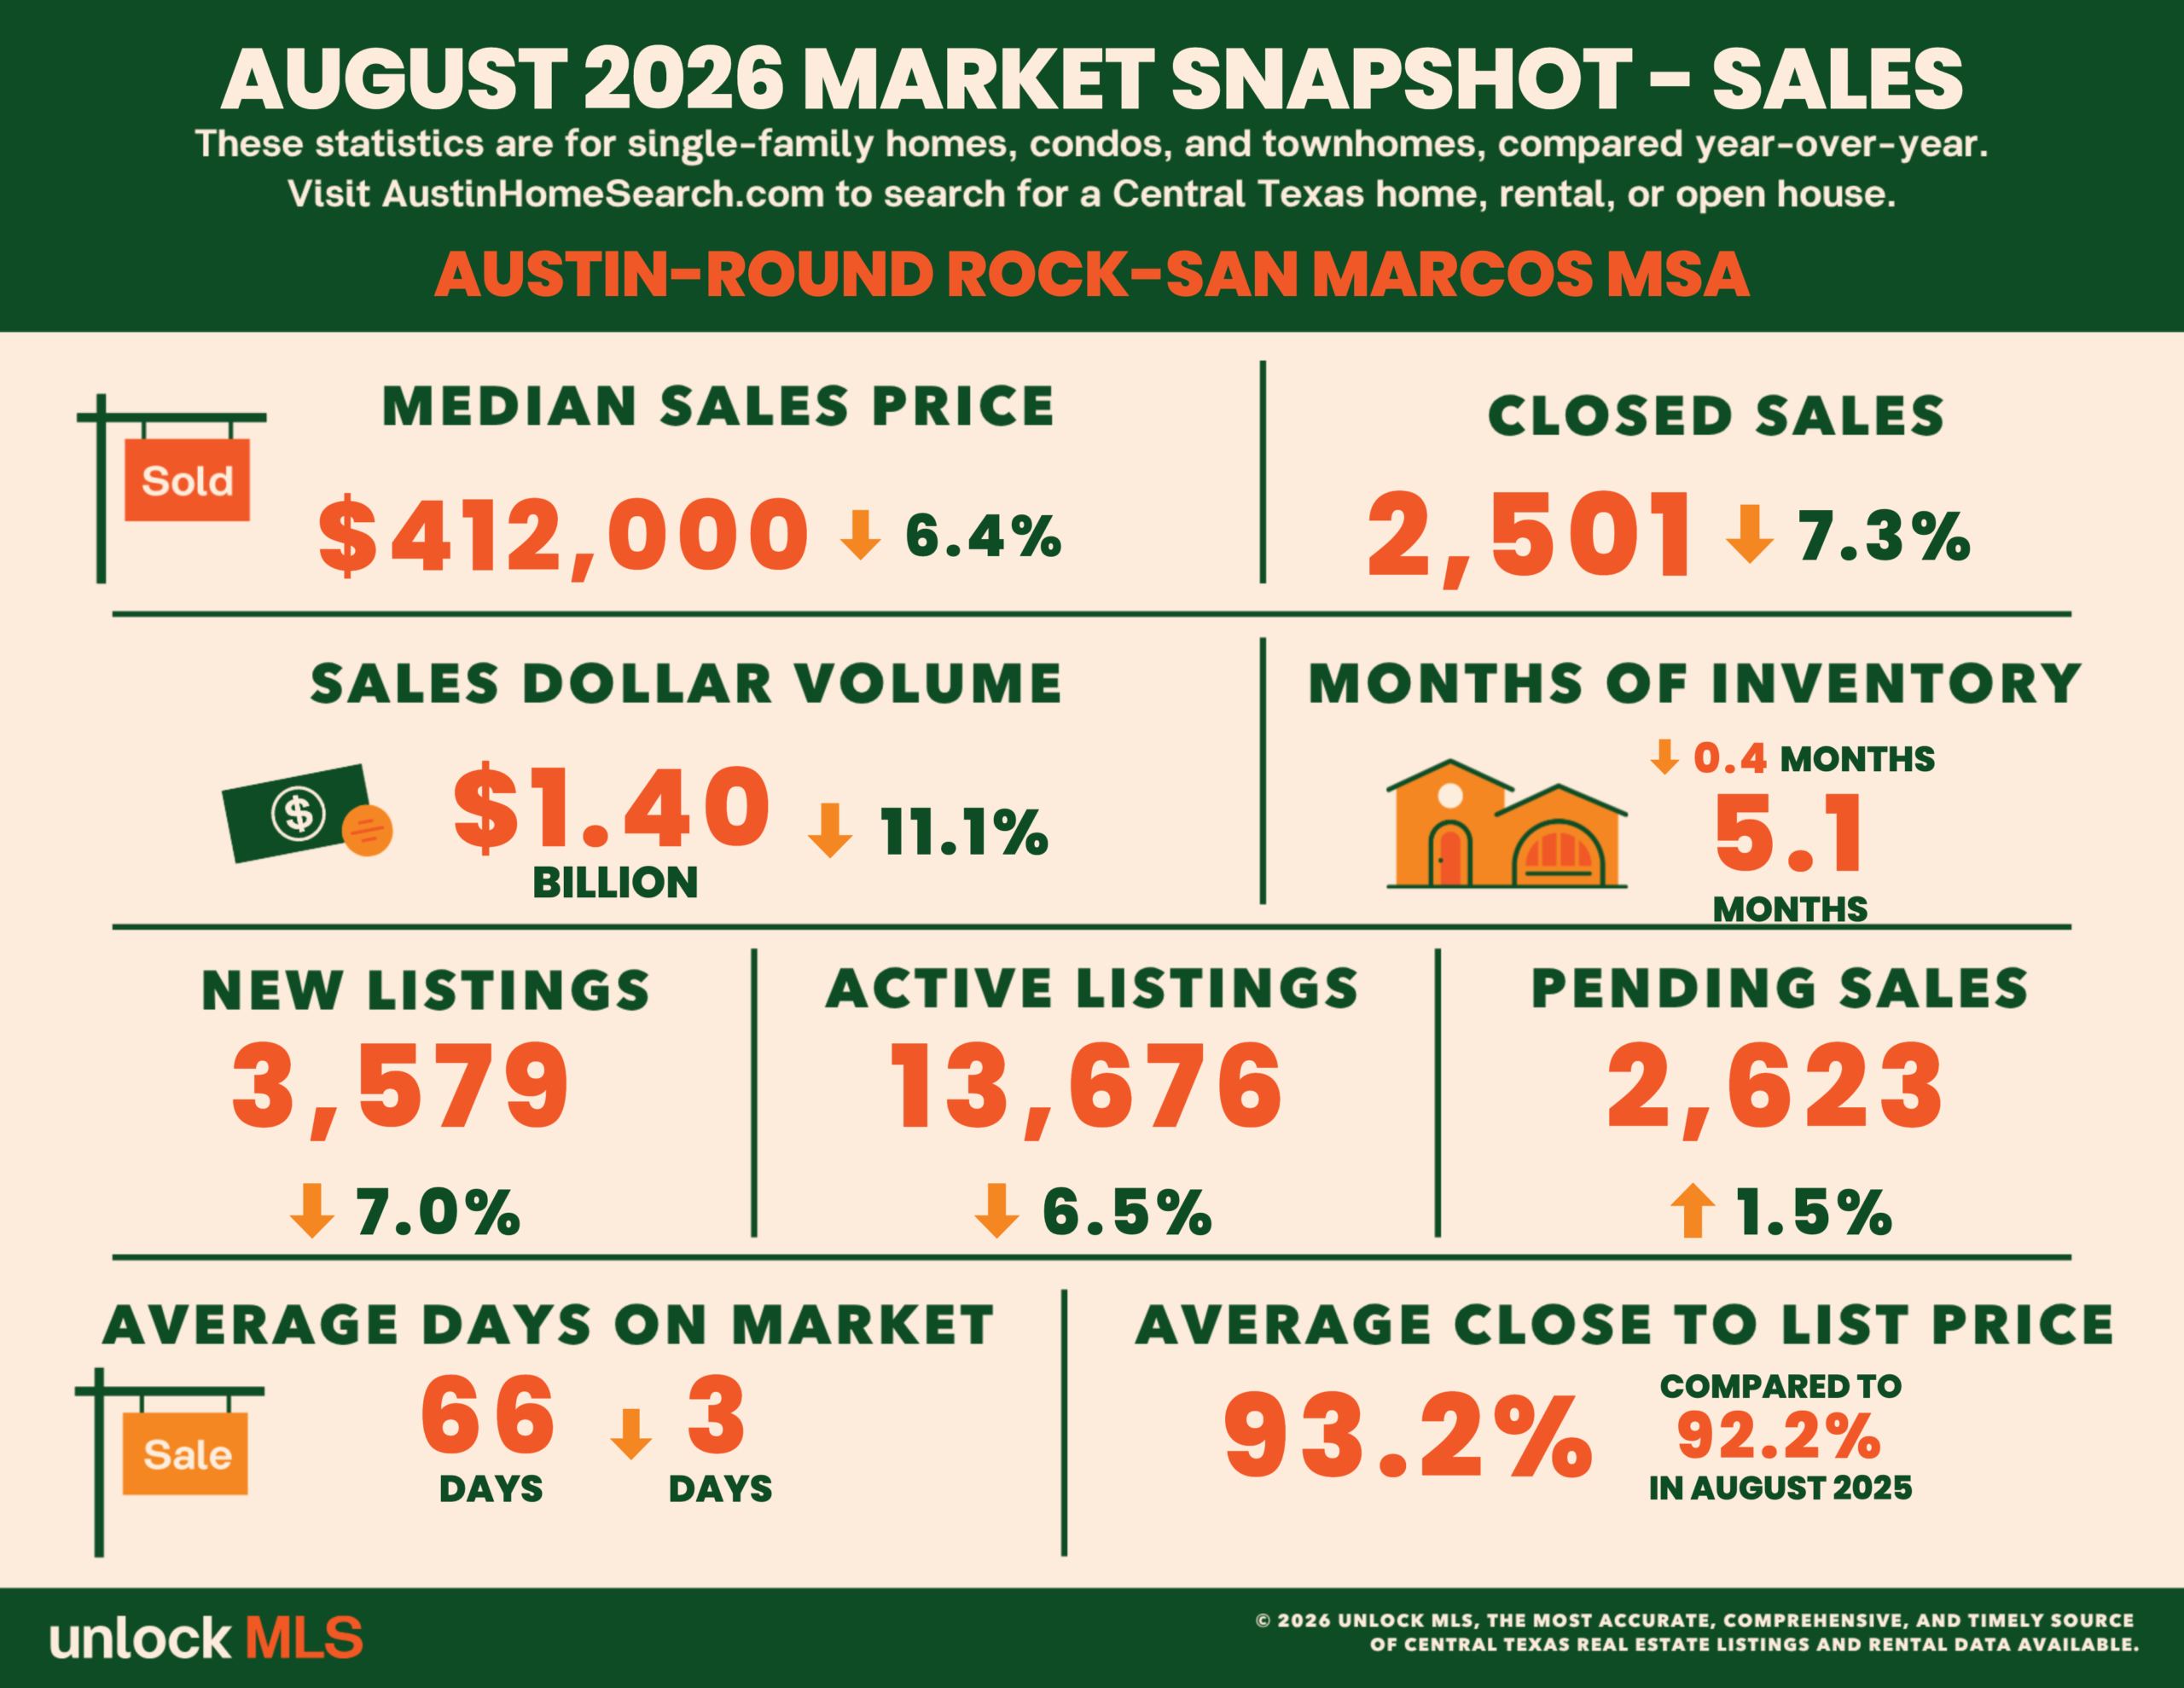
Central Texas real estate lost some of its summer footing in August. Data from Unlock MLS and the Austin Board of Realtors shows residential sales across the Austin-Round Rock-San Marcos metro fell 7.3% year-over-year to 2,501 homes, the median sale price dropped 6.4% to $412,000 after two straight months of annual gains, and active inventory eased alongside softer demand—even as pending sales ticked up 1.5%, a modest sign that some buyers are still stepping in at lower prices. Austin Realty Insights tracks this data so you don't have to.

$412,000 Median Sale Price ↓ 6.4% YoY
2,501 Closed Sales ↓ 7.3% YoY
+1.5% Pending Sales YoY One bright spot
$560,000 City of Austin Median ↓ 4.3% YoY
5.1 mo. MSA Inventory ↓ 0.4 mo. YoY
Market Analysis

What the August 2026 ABoR Data Really Tells Us

The August 2026 Central Texas Housing Report from Unlock MLS and the Austin Board of Realtors shows the region losing some of the momentum it built over June and July. Across the Austin-Round Rock-San Marcos MSA, residential sales fell 7.3% year-over-year to 2,501 homes, while the median sale price dropped to $412,000—down 6.4% annually and a reversal from two consecutive months of positive year-over-year pricing. Total dollar volume fell 11.1% to roughly $1.4 billion, a sharper pullback than the sales decline alone would suggest.

Pending sales still managed a 1.5% year-over-year gain to 2,623 transactions, suggesting some buyers remain active even as closed sales slow. Vaike O'Grady, market research advisor at Unlock MLS, tied the shift to broader national conditions rather than anything specific to Central Texas, noting that higher interest rates and affordability pressure are weighing on buyer activity across the country.

"Austin is not immune to what is happening across the rest of the country."

— Vaike O'Grady, Market Research Advisor, Unlock MLS

Supply eased as well. Active listings across the metro fell 6.5% year-over-year to 13,676 homes, alongside a 7.0% drop in new listings to 3,579. Months of supply came in at 5.1, actually down 0.4 months from August 2025, and the average close-to-list ratio rose to 93.2% from 92.2% a year earlier—a signal that pricing discipline, not just demand, is shaping how quickly homes move.

Inside the City of Austin, sales dropped 10.3% year-over-year to 844 homes, while the median price fell to $560,000, down 4.3% from August 2025. That builds on July's 1.4% annual decline inside city limits, extending a softer pricing trend even as the broader metro had briefly stabilized earlier in the summer. City inventory tightened to 4.6 months, down from a year ago despite the slowdown in sales.

Travis County saw sales fall 9.5% year-over-year to 1,111 closed transactions at a median of $489,000, down 6.4% annually, with 5.1 months of inventory. Most counties in the report followed the same pattern—Williamson, Hays, and Bastrop counties all posted lower sales and softer prices than a year earlier. Caldwell County was the exception, with sales up 24.2% and its median price climbing 17.4% to $270,000, though the county's small transaction volume makes month-to-month swings there more pronounced than in the larger counties.

John Crowe, 2026 Unlock MLS and ABoR president, characterized the pullback as a normal shift rather than a cause for alarm, pointing to the value of local real estate expertise in helping buyers and sellers interpret what changing conditions mean for their own decisions. Continued job growth and business investment across the region, O'Grady added, remain signs of underlying strength even as national interest-rate pressure works its way into local numbers.

August 2026 — Most Recent County Data

County-by-County Market Breakdown

Geography Closed Sales Sales Change YoY Median Price Price Change YoY Months of Inventory
City of Austin 844 ↓ 10.3% $560,000 ↓ 4.3% 4.6
Travis County 1,111 ↓ 9.5% $489,000 ↓ 6.4% 5.1
Williamson County 855 ↓ 4.1% $399,900 ↓ 5.9% 4.6
Hays County 396 ↓ 8.1% $355,000 ↓ 1.4% 5.5
Bastrop County 98 ↓ 14.8% $342,495 ↓ 5.1% 7.4
Caldwell County 41 ↑ 24.2% $270,000 ↑ 17.4% 7.3
Austin-RR-SM MSA 2,501 ↓ 7.3% $412,000 ↓ 6.4% 5.1 (−0.4 YoY)

Source: Unlock MLS & Austin Board of Realtors® (ABoR) — August 2026 Central Texas Housing Report, released September 15, 2026. Full report available at UnlockMLS.com/Stats. Data reflects MLS-reported activity only and may be revised in subsequent releases.

Market Implications

What This Market Means for You

For Buyers

Prices Pull Back—More Room to Negotiate

August marked the sharpest annual price decline in the Austin metro in months, with the MSA median down 6.4% to $412,000 and City of Austin prices down 4.3%. Homes still closed at 93.2% of list price on average, and with sales down 7.3% while inventory holds relatively steady, buyers who can move now have more negotiating leverage than they did earlier this summer.

For Sellers

Slower Sales Put a Premium on Accurate Pricing

Closed sales fell across nearly every county in August, with City of Austin volume down 10.3% year-over-year and Travis County down 9.5%. Pending sales still rose 1.5% metro-wide, though, so buyer demand hasn't disappeared—sellers who price realistically against current comparables are still finding it, particularly in counties where inventory remains tight.

For Investors

Lease Market Keeps Tightening on the Supply Side

Austin's lease market cooled further in August, with closed leases down 6.2% year-over-year across the MSA and median rent holding flat at $2,150. Active lease listings fell sharply again (down 27.9% annually), suggesting the rental supply pipeline keeps thinning even as rents stay steady—a dynamic worth watching for investors as home prices soften and more buyers weigh renting instead.

Austin Rental Market — August 2026 (Austin-Round Rock-San Marcos MSA)

Austin's Rental Market Continues to Cool as Rents Hold Flat

The Austin-Round Rock-San Marcos MSA lease market cooled further in August 2026, the most recent month with full leasing data published in Unlock MLS's monthly report at time of writing. 2,920 leases closed during the month, down 6.2% year-over-year, while pending leases eased slightly to 2,852, down 0.4% from a year earlier—a continuation of the softer rental demand seen through the summer.

Median rent across the MSA held flat at $2,150 per month compared with August 2025, giving renters roughly the same value as a year ago. Active lease listings fell sharply—down 27.9% year-over-year to 4,296 units—while months of lease inventory compressed to 1.6, down 0.7 months annually. For property investors, a shrinking active-listing base alongside softer closed-lease volume suggests the rental pipeline keeps tightening even as landlords hold rents steady in a metro where easing home prices may pull some renters back toward buying.

2,920 Closed Leases ↓ 6.2% YoY
$2,150 Median Monthly Rent Flat YoY
2,852 Pending Leases ↓ 0.4% YoY
4,296 Active Lease Listings ↓ 27.9% YoY

Central Texas Coverage Area

Hyperlocal Expertise Across the Greater Austin Metro

Austin Realty Insights tracks real estate conditions across every corner of the 18-county Central Texas region—from the dense urban core of Travis County to the fast-growing suburban corridors of Williamson, Hays, Bastrop, and Caldwell counties. Whether you're focused on a specific ZIP code in East Austin or evaluating investment opportunities in the outer ring suburbs, our market intelligence is grounded in the same MLS data that powers the official ABoR Central Texas Housing Report.

Travis County Williamson County Hays County Bastrop County Caldwell County East Austin Mueller South Congress Hyde Park Tarrytown Westlake Hills The Domain Round Rock Cedar Park Pflugerville Georgetown Leander Kyle Buda Bastrop